Introduction
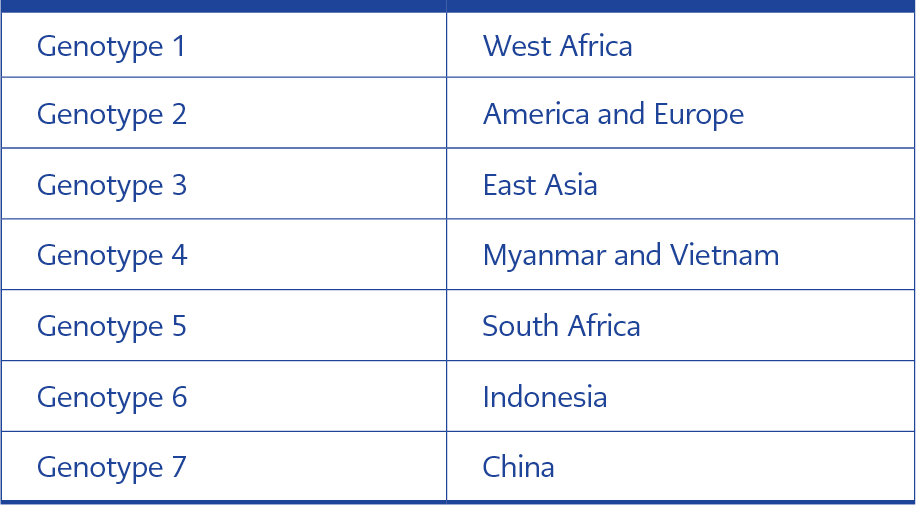
Table 1. Worldwide distributions of HPgV-1 genotypes.
Human pegiviruses (HPgV-1 and HPgV-2) are enveloped, single-stranded positive-sense RNA viruses belonging to the Pegivirus genus in the Flaviviridae family. HPgV has a genome of 8.9-11.3 kb, and the virion size is estimated at around 50-100 nm (1). Seven genotypes of HPgV-1 differ geographically (Table 1). Two subtypes of genotype (GT) 2, which is common in Europe, have been defined, a and b. GT 7 is limited in China only. In a study conducted in China in 2017, GT 7 and another unclassifiable group of HPgV-1 were mentioned according to the sequence analysis performed by targeting the E2 gene. Generally, the 5’UTR region and, less frequently, the E2 gene region are used for genotyping the virus (2). In the few genotype studies conducted in Türkiye, 5’UTR regions were examined, and as a result, GT 2 was found to be the most common genotype (3-7)
While HPgV-1, which used to be called GBV-C/HGV formerly, was thought to be hepatotropic in previous studies, it has been detected in bone marrow, spleen, cerebrospinal fluid, T and B lymphocytes, and peripheral blood mononuclear cells according to epidemiological studies in recent years (8, 9). Findings support the view that the virus is lymphotropic. Although pegiviruses usually cause persistent, asymptomatic infections in healthy individuals, their association with any disease in humans has not been demonstrated so far. This increases the possibility of the virus being in a commensal or symbiotic relationship with humans, suggesting that it may be a part of the microbiome (8).
According to cross-sectional studies on the frequency of HPgV-1 viremia, viremia is found in 1-5% of healthy blood donors in developed countries, while this rate rises to 20% in developing countries (10). While the infection is more common in young adults, the risk of HPgV-1 infection decreases with increasing age, which is thought to be due to higher sexual activity in young adults (2).
HPgV can be transmitted from person to person through exposure to infected blood, sexual contact, and transmission from mother to baby (11, 12). Since it has common transmission routes with HIV, such as sexual contact, its frequency increases up to 20-41% in people co-infected with HIV/HPgV-1 (2, 13). The frequency of HPgV-2 is lower than HPgV-1 (14). There are studies showing that HPgVs, especially HPgV-1, have a positive effect on survival in HIV-infected patients and slow down the process and progression of the disease by inhibiting HIV replication (15, 16). According to the mechanism, the HPgV-1 E2 glycoprotein and the phosphoprotein produced from the NS5A region of the genome play a role in its effect on HIV infection. The NS5A phosphoprotein of HPgV-1 exerts its effect by reducing the surface expressions of HIV, CCR5 and CXCR4 chemokine receptors and the mRNA level of the HIV receptor CD4 in the cell (17, 18). It increases the release of soluble ligands of CCR5 (RANTES, MIP-1α, MIP-1β) and SDF-1, the ligand for CXCR4. It also reduces the proliferation and activation of infected cells by acting on CD4+ T cells. The E2 envelope glycoprotein of HPgV-1, on the other hand, prevents HIV from binding to or fusing with the T cell due to its similarity with HIV gp41 (18). Although there is information that HIV/HPgV-1 coinfection decreases CD4 mRNA expression, some publications have reported that CD4 counts are higher in people with HIV/HPgV-1 coinfection compared to people without coinfection. This higher CD4 level may also vary according to HPgV genotypes (19-21).
This study was motivated by the fact that new types of HPgV have been defined in recent years, and the biological and epidemiological features of the virus have become better understood alongside developments in its classification. We aimed to investigate the frequency and genotype diversity of HPgV in HIV-infected individuals who are antiretroviral therapy (ART)-naive. Healthy individuals with negative routine serological tests were also included in the study to determine the prevalence of HPgV in the general population simultaneously.
Materials and Methods
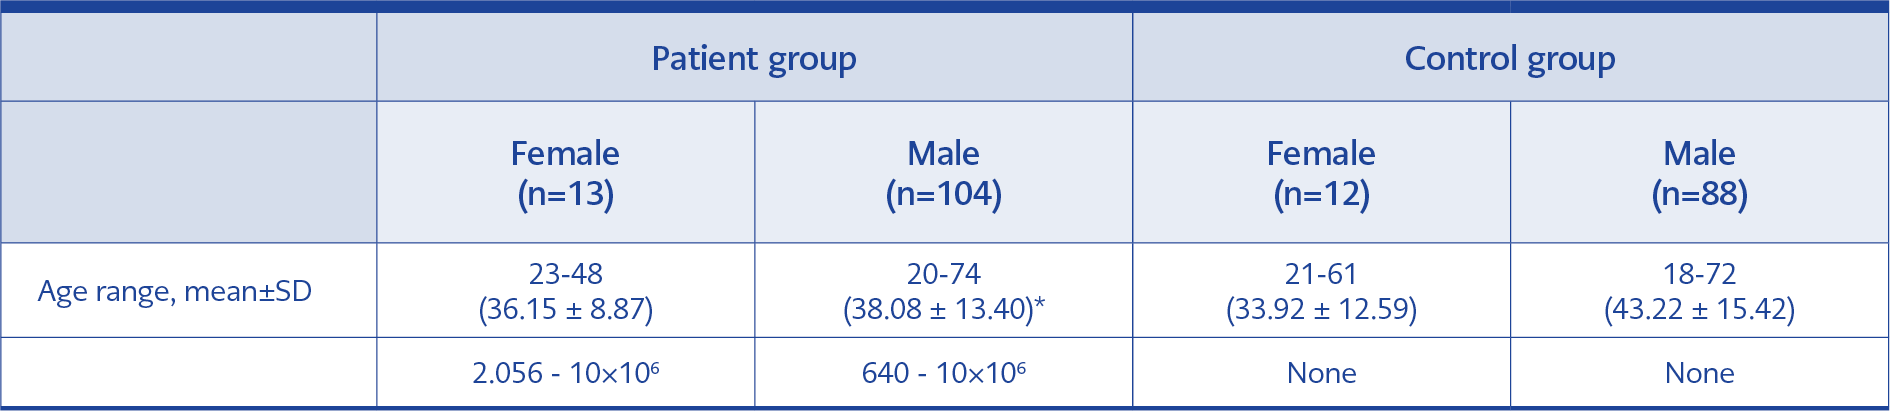
Table 2. Demographic data of the control / patient group.
This study included frozen and stored plasma samples of HIV-infected, ART-naive patients, which were routinely sent to Cerrahpasa Faculty of Medicine, Molecular Microbiology Laboratory for HIV RNA detection and HIV drug resistance analysis between January and September 2019. The control group was selected from individuals whose serum samples were not detected with anti-HCV, anti-HIV1/2, and HBsAg reactivity and sent to the Microbiology-Serology/ELISA Laboratory from various clinics of our institution. The control group was matched with the patient group in terms of age and gender, and serum samples were selected randomly (Table 2). The study did not include samples belonging to pregnant women and individuals younger than 18 years.
İstanbul University-Cerrahpaşa, Cerrahpaşa School of Medicine Clinical Research Ethics Committee approved the study on January 08, 2019, with the decision number A-04.
RT-nested PCR preparation for HPgVs
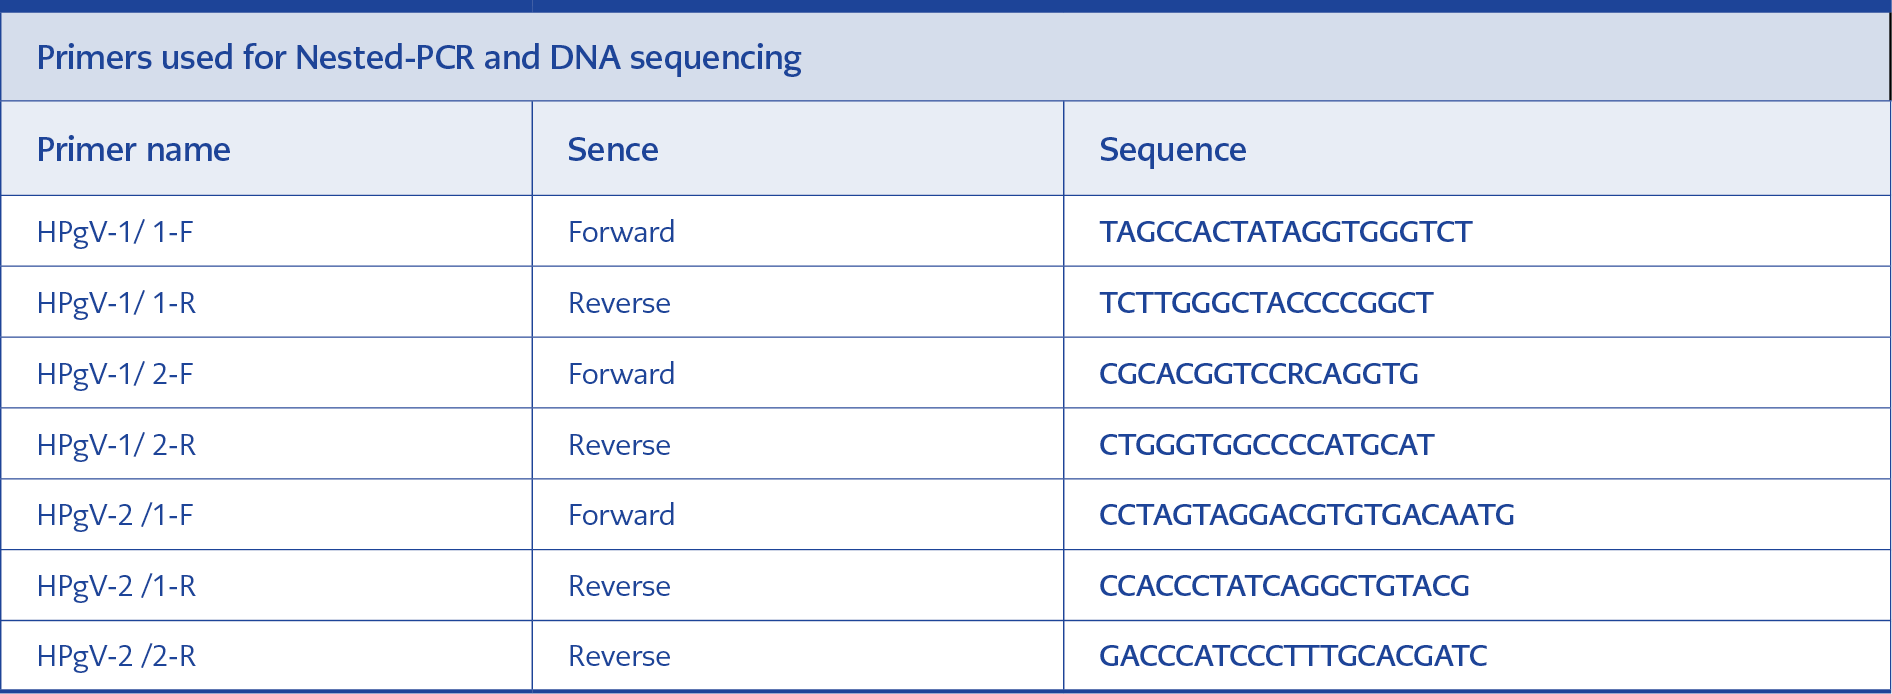
Table 3. Primer sequences prepared from the 5’UTR region (100 μM).
Before the study, the stored plasma samples of the patients were removed from the freezers following the procedure and melted at room temperature. RNA isolation was performed using the DSP Virus/Pathogen Midi Kit (QIAGEN, Germany) and the QIAGEN QIAsymphony SP automated system (QIAGEN, Germany) by taking 500 µl of plasma samples in accordance with the manufacturer’s instructions. Subsequently, reverse transcription (PrimeScript Takara Bio. Inc., Japan) was performed. For cDNA synthesis in the reaction, HPgV-1/1-R and HPgV-2/1-R from the primer sets in Table 3 were used for reverse transcription (14, 22, 23).
HPgV RNA was searched in samples after reverse transcription using the nested-PCR method. For this purpose, the sequences of the reference strains of HPgV (KP710598, U36380, KM670099, KM670101, KM670108, KM670106, KM670096, KC618399, KP710600, AF104403, LT009494, D90600, U45966, AY196904, LT009485, LT009487, LT009489, AF309966, D87255, LT009483, AF031827, U44402, AF121950, AB003289, U63715, D87713, AB018667, AY949771, AB008336, KX528230, KY971607, KY971606, KX528231, AB013500, U59522, U59519, U59527, U59528, U59526, U59524, U59527) were downloaded from the GenBank database (https://www.ncbi.nlm.nih.gov/genbank/) and aligned with the ClustalW program 5.0.9 included in the BioEdit program 5.0.9. Primers with sequences in Table 3 and recognizing the 5’UTR region were designed from these reference origin regions. Second-step primers could be designed to cover all genotypes from the 5’UTR region to detect HPgV-1, whereas a semi-nested PCR method was applied to amplify HPgV-2 (14, 22, 24).
Nested PCR
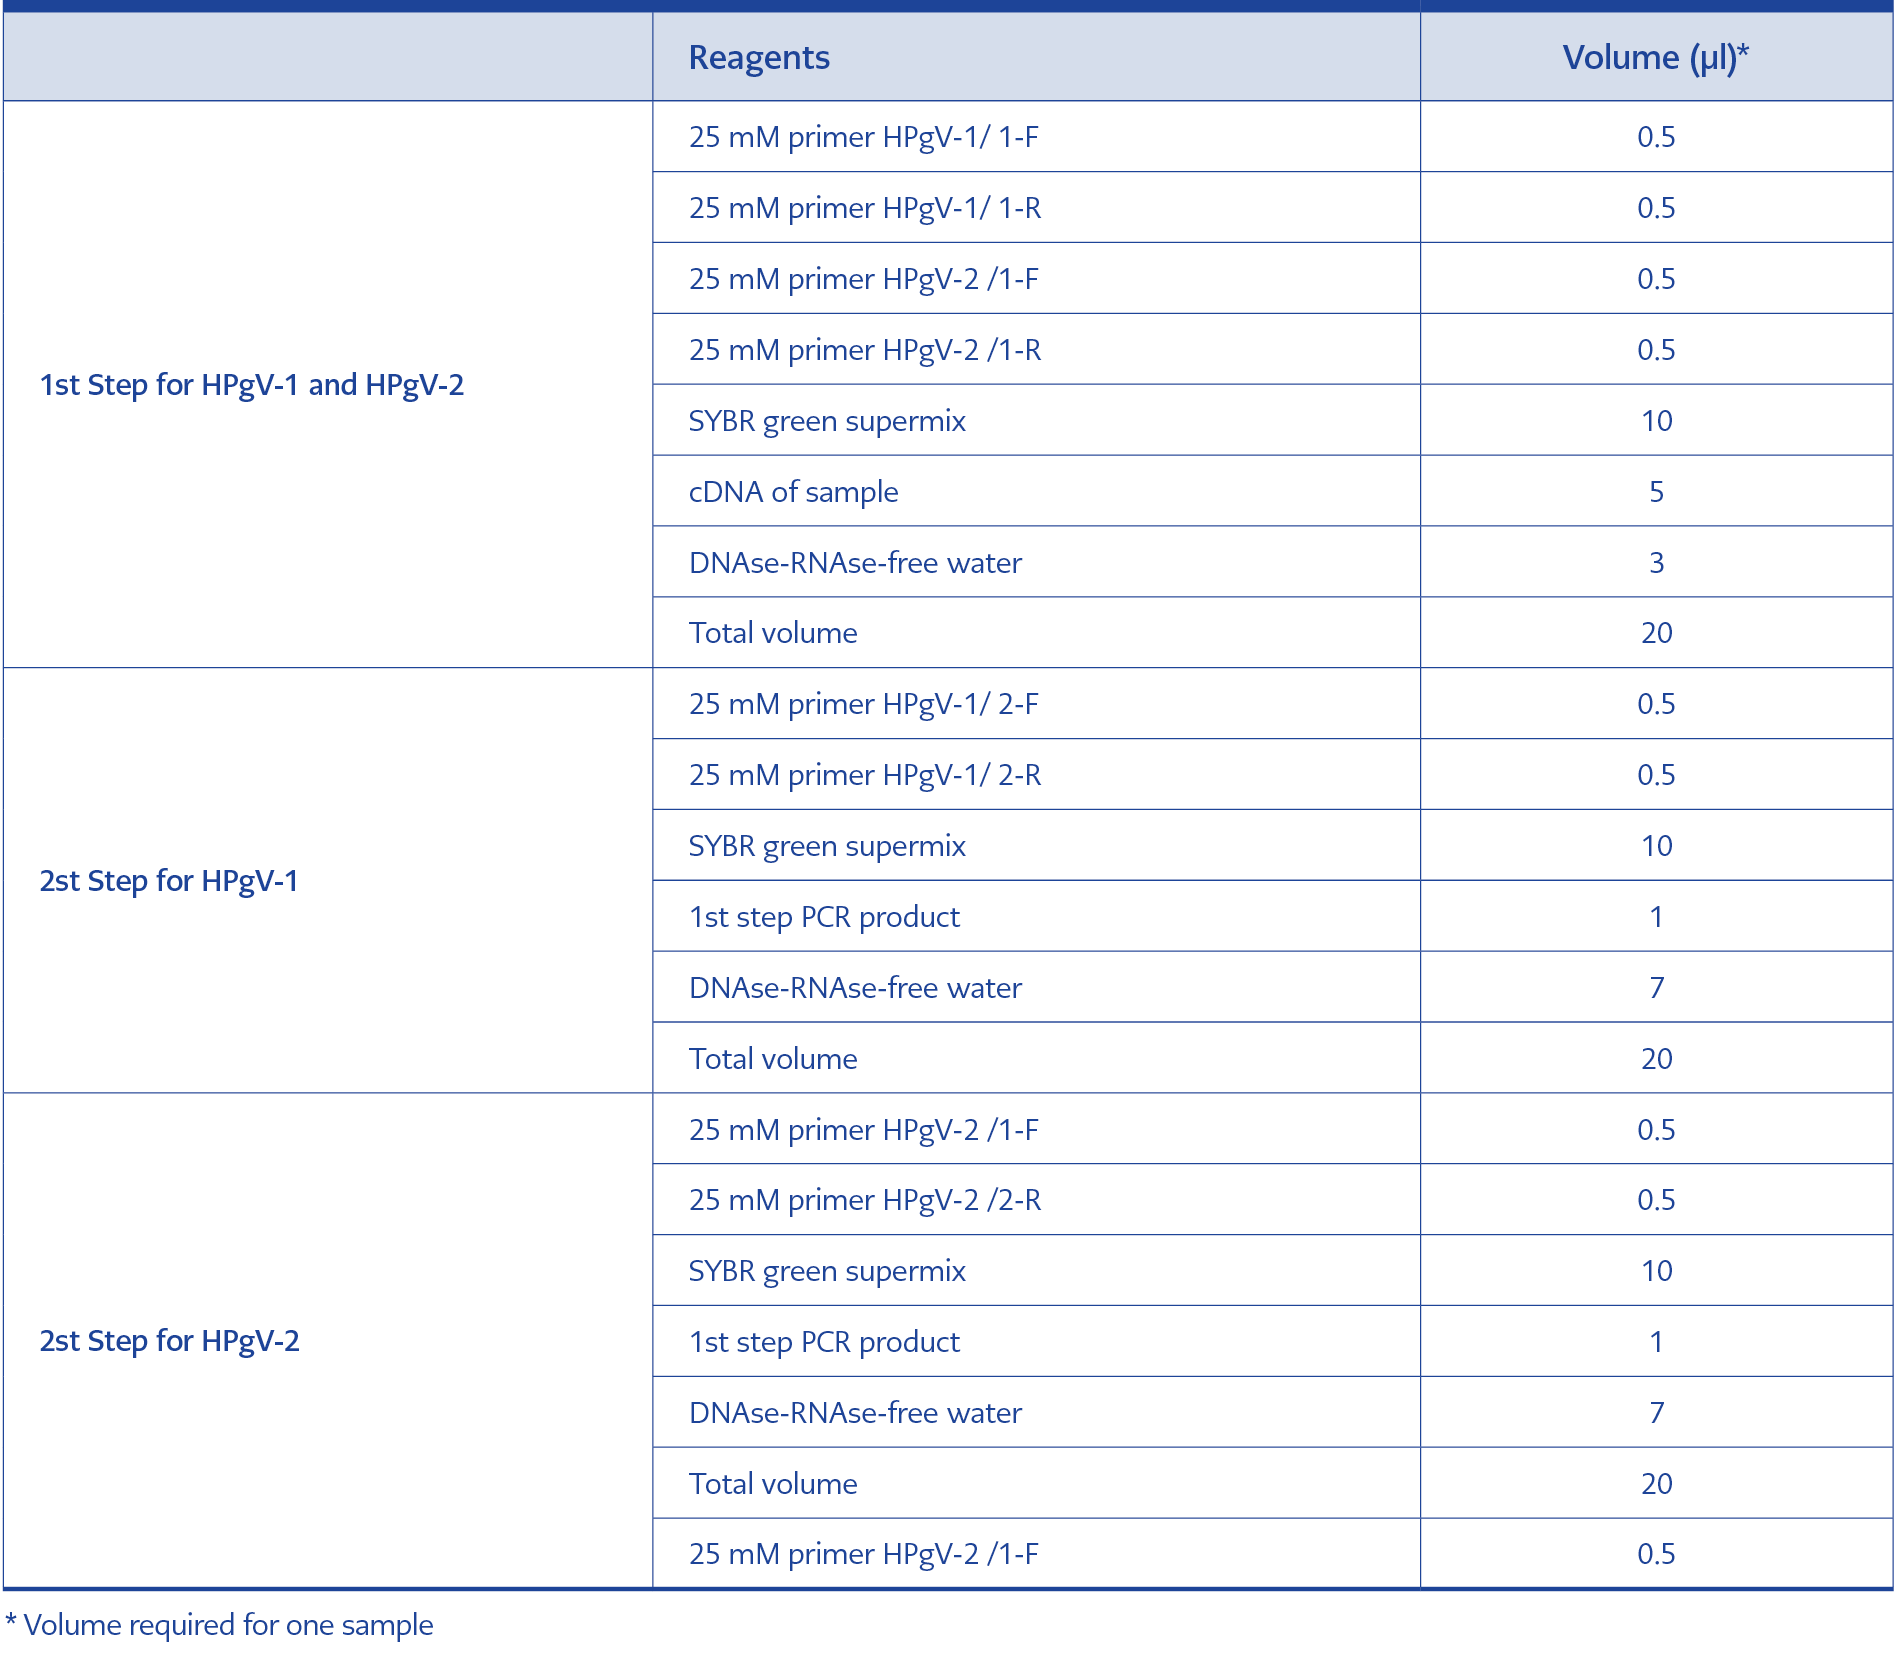
Table 4. Reagents required for the first and second steps of PCR.
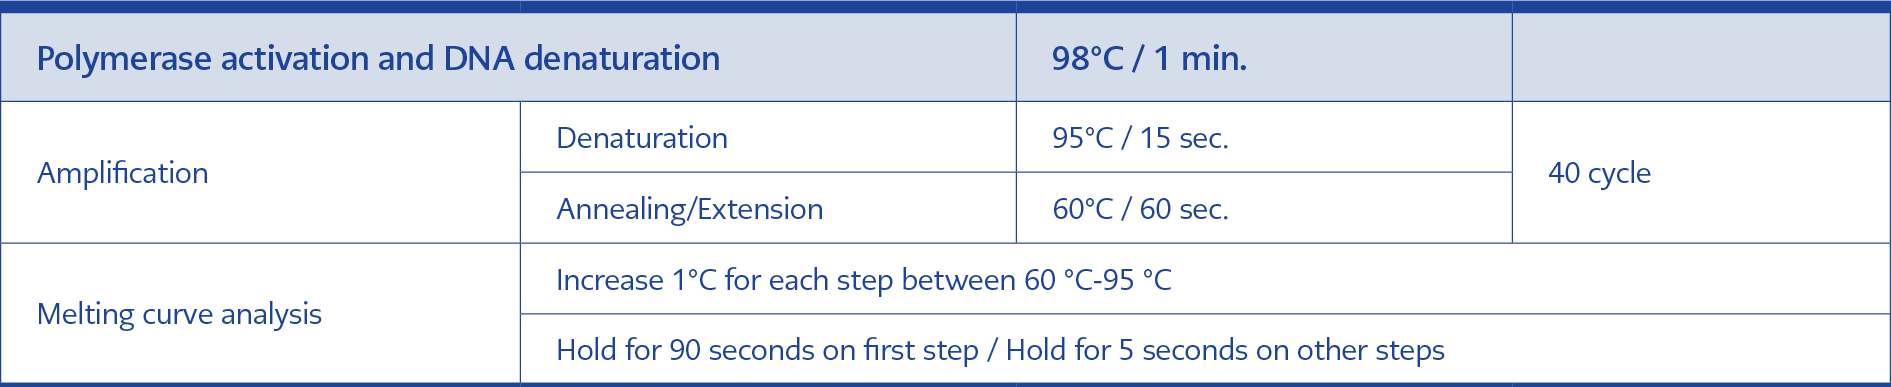
Table 5. Real-time polymerase chain reaction (PCR) protocol.
The first-step PCR process was performed in a multiple-test format using primers from both viruses (HPgV-1 and HPgV-2) in a single tube. In the second step, PCR was performed in separate tubes using the second-step primers of each virus. The reagents and volumes used are shown in Table 4. The real-time PCR program used for the first and second steps is also shown in Table 5. The serum samples of the control group were passed through isolation, reverse transcription and nested PCR stages, respectively, using the same kits in which the plasma samples of the patient group were studied. All samples were displayed by agarose gel electrophoresis, and samples considered positive (~300 bp for HPgV-1, ~150 bp for HPgV-2) were included in sequence analysis.
Sanger sequencing
ABI 3130 genetic analyzer (Applied Biosystems Inc., USA) device was used for Sanger sequencing analysis, and the “Sequencing Analysis v5.2.0” software was used to process the raw data obtained after sequencing analysis. The analyzed forward and reverse sequence data (Analyzed ABI files (.ab1) extension) were matched with the DNAStar SeqMan program (DNASTAR Inc., USA) and assembled into a single consensus sequence. Control of the obtained sequences was first performed on the web using the BLAST program (National Center for Biotechnology Information, USA). Then, the data of the patients and controls and the reference (KM670101, KP710600, GT1, U59522, U59519, U59527, U59528, U59526, U59524, U44402 GT 2a, U63715, LT009489, U59527, GT 2b, D87713, GT 3, AB018667, GT 4, AY949771, GT 5, AB008336, GT 6) downloaded from the GenBank were combined with the ClustalW program included in the BioEdit program, and the “alignment” file was created. Phylogenetic analysis of the obtained “alignment” file was performed with MEGA-X software using the “Neighbor-Joining” method. The bootstrap test (1000 replicates) was used to assemble related taxa and test the phylogenetic tree. The tree is drawn to scale, with branch lengths in the same units as those of the evolutionary distances used to infer the phylogenetic tree. The evolutionary distances were computed using the Maximum Composite Likelihood method (14, 22, 24).
Statistical Analysis
For statistical analysis, the data of the samples used in the study was coded and evaluated in the Statistical Package for Social Sciences (SPSS) 21.0 (IBM Corp., Armonk, NY, USA). The difference in HPgV-1 RNA levels between the patient and control groups was assessed. Student’s t-test was used to compare group means for normally distributed parametric data, while the chi-square test was applied for categorical variables. The results were reported as mean ± standard deviation (mean ± SD) and evaluated within a 95% confidence interval (CI). A p-value of less than 0.05 (p<0.05) was considered statistically significant.
Results
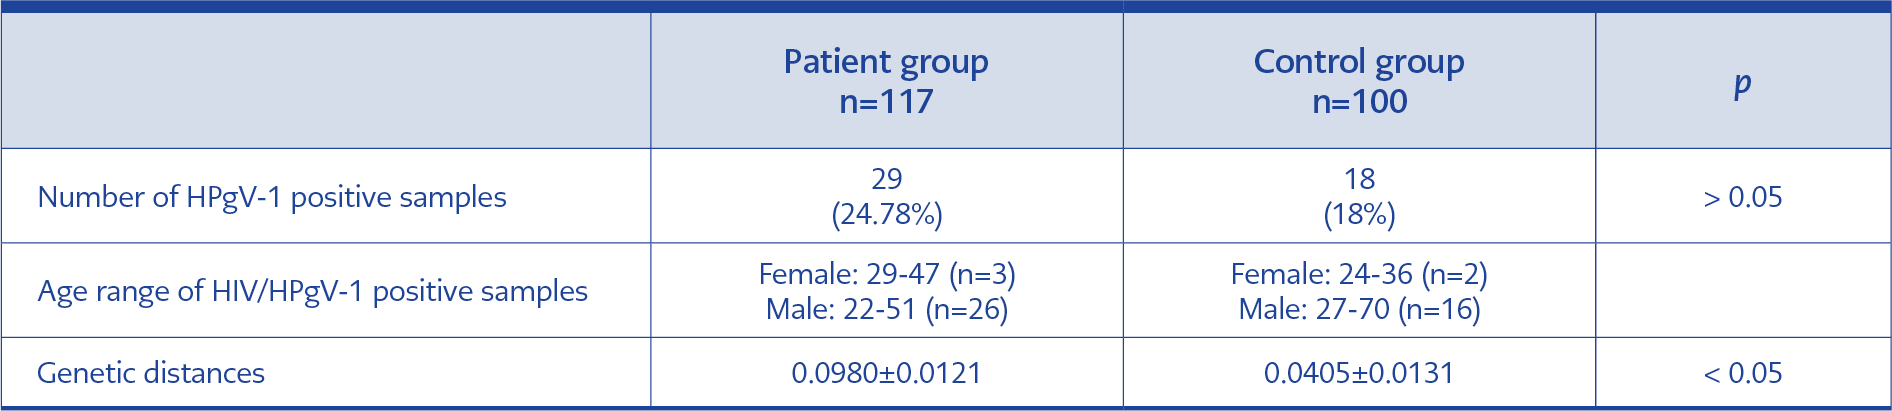
Table 6. Positive sample distributions and genetic distances of DNA sequences obtained in the study.
A total of 117 plasma samples from HIV-infected, antiretroviral therapy-naive patients and 100 control serum samples were included in the study. The HIV-infected patient group had 13 females and 104 males; the control group had 12 females and 88 males (Table 2). HPgV-1 RNA was found positive in 29 of 117 (24.78%) samples in the patient group, while it was positive in 18 of 100 (18%) samples in the control group (p=0.2264). The average HIV viral load of 29 samples with HPgV-1 detected in the patient group was 247,808.41 ± 784,088.362 copies/mL, while it was 427,111.25 ± 1,511,994.736 copies/mL in the control group (p=0.319) (Table 6). When evaluating the relationship between age and gender and HPgV-1 RNA positivity rates, sample data of HIV-positive-ART naive patients and control group data were combined because of the small sample size. The mean age of 47 people with positive HPgV-1 RNA was 38.66 ± 12.11 years, while the mean age of 170 people with negative HPgV-1 was 40.14 ± 14.79 (p=0.0121). When the groups were divided as <40 years old and ≥40 years old, HPgV-1 RNA was positive in 32 (25.80%) of 124 individuals under 40 years of age, while HPgV-1 RNA was positive in 15 (16.12%) of 93 individuals aged 40 and over (p=0.00044). When the cases were evaluated comparatively based on gender, HPgV-1 RNA was positive in 5 (20%) of 25 female patients, and HPgV-1 RNA was positive in 42 (21.87%) of 192 male patients (p=0.662).
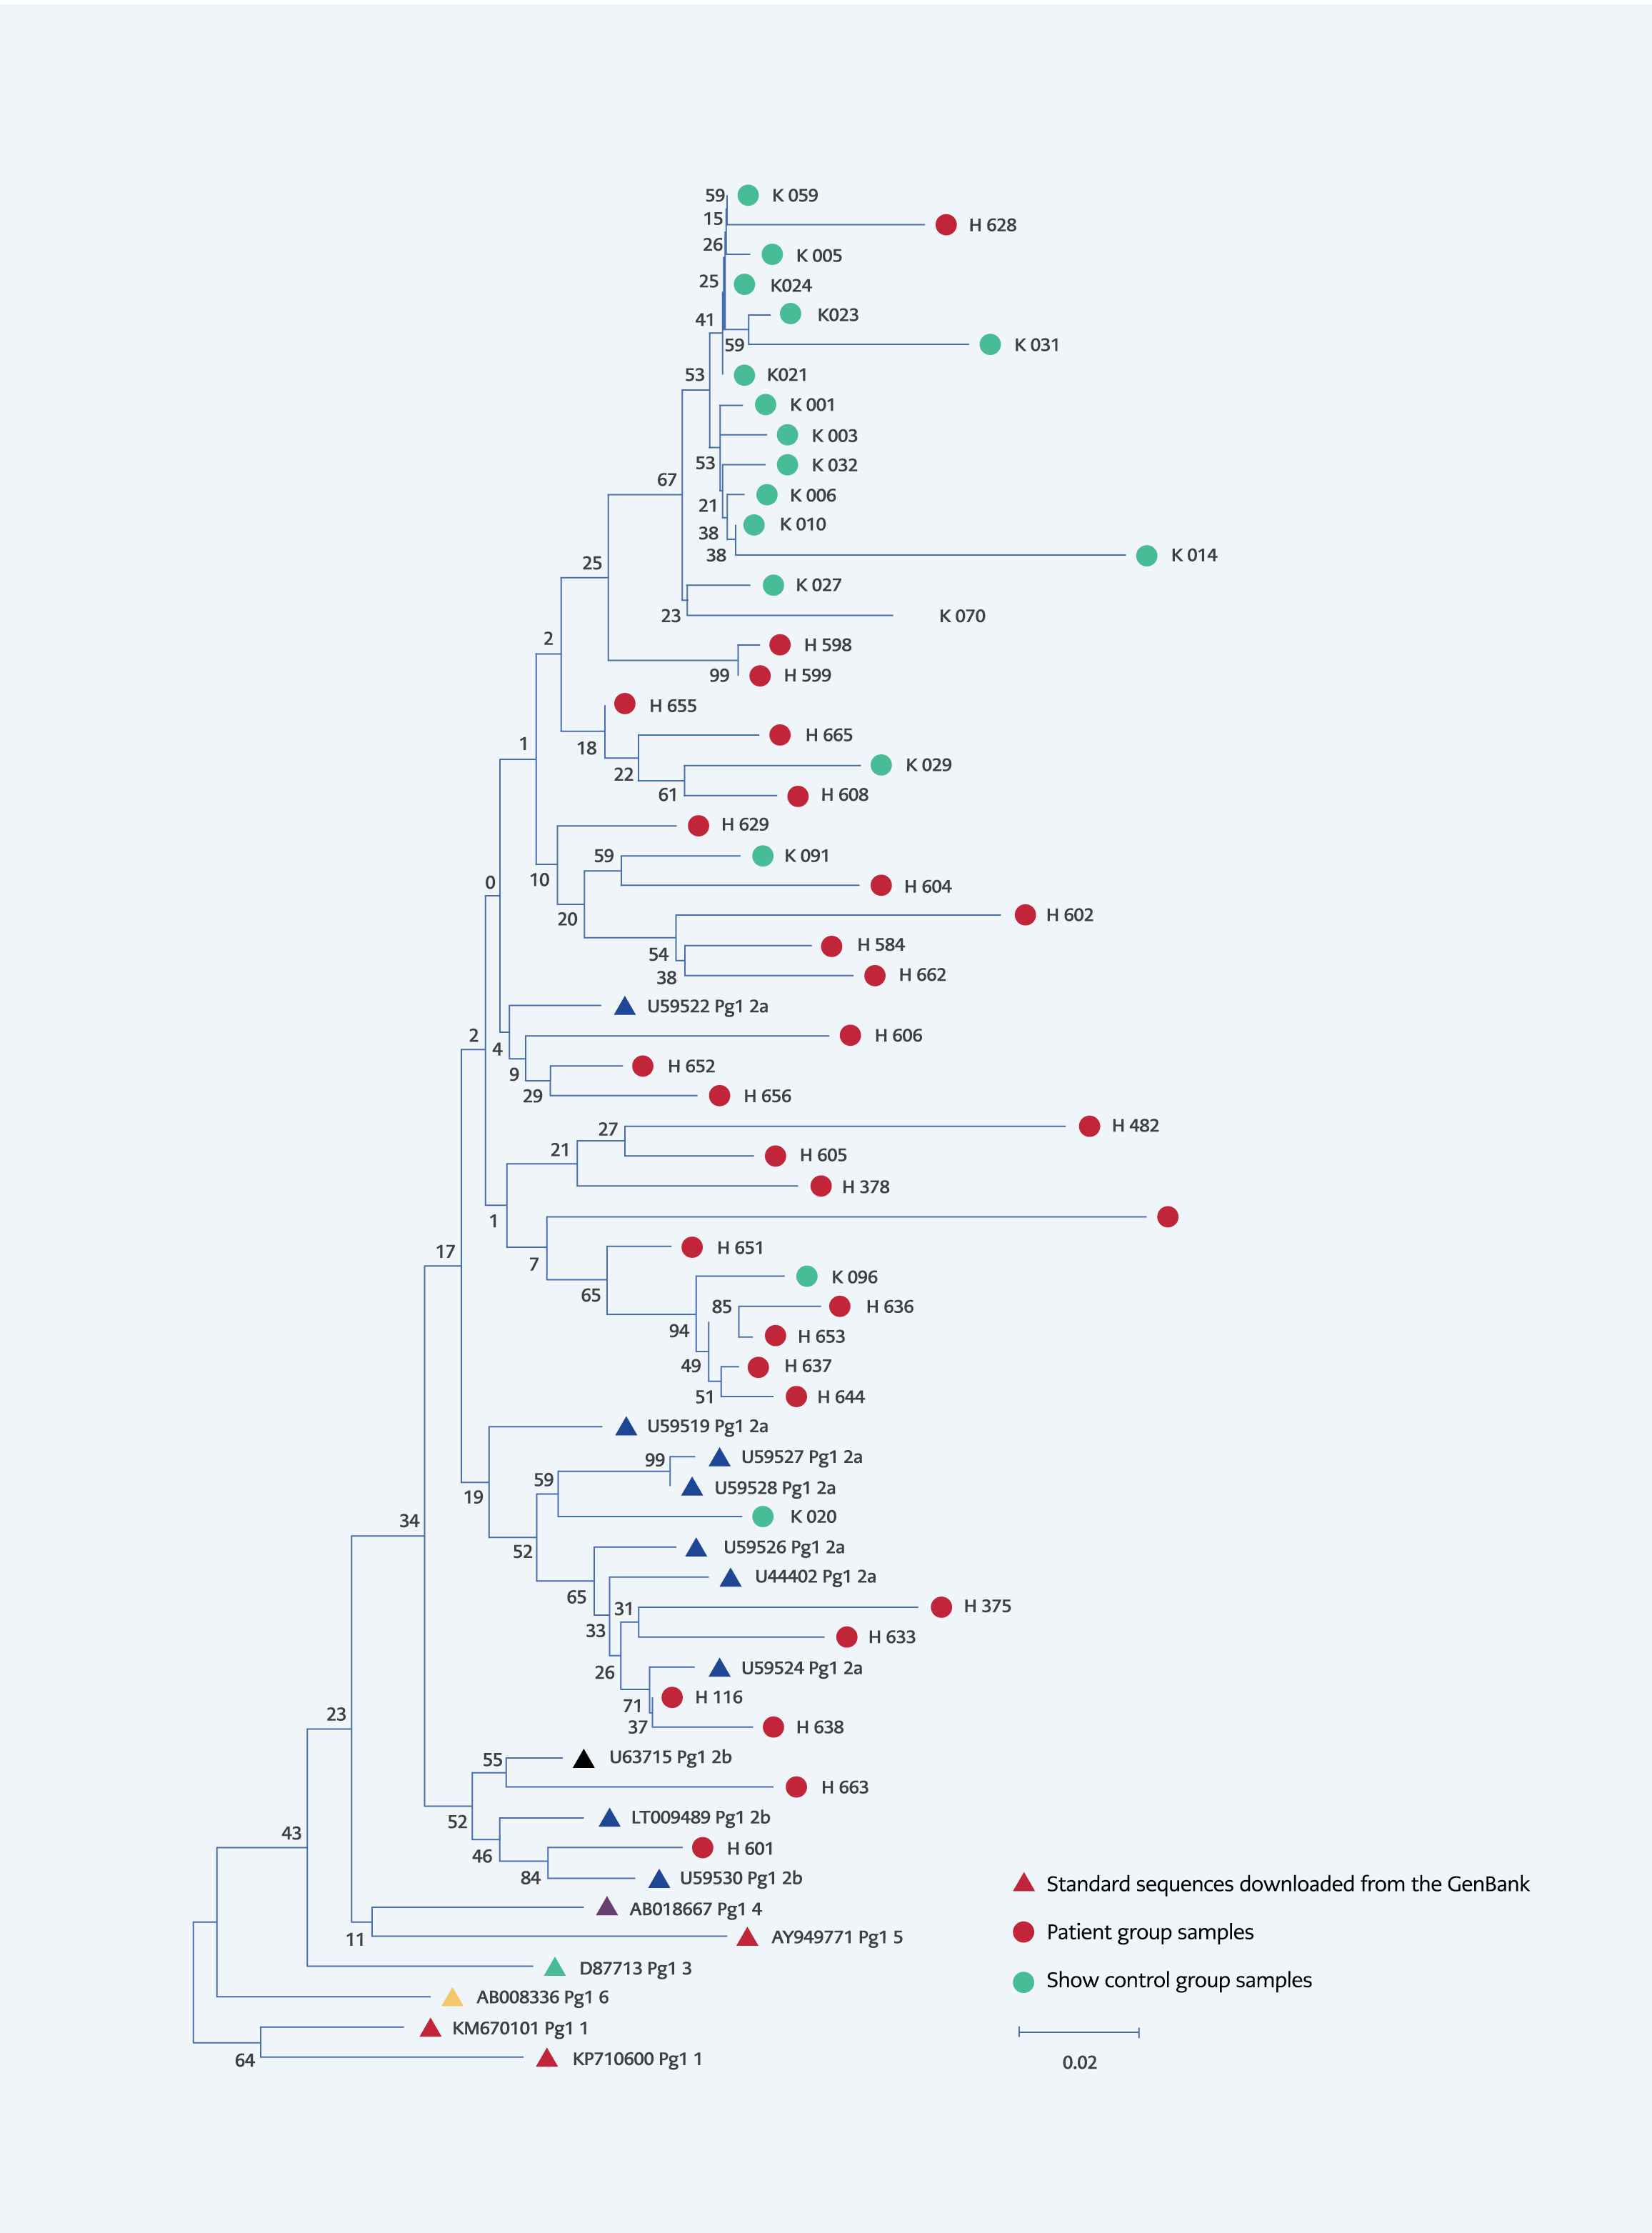
Figure 1. Phylogenetic tree patients-controls and standard sequences downloaded from the GenBank. (Drawn using the “Neighbor-Joining” method, “bootstrap” test (1000 replicates) was use to test the tree, evolutionary distances were calculated using the “Maximum Composite Likelihood” method, total branch lenght=1.74559562.
When the phylogenetic analysis of the HPgV-1 positive samples was performed, all of the sequences obtained from HIV-infected individuals and from the control group were classified as HPgV-1 GT 2. Of these, all the samples belonging to the control group were in GT 2a, while 27 of the 29 samples belonging to the patient group were in 2a, and two were in 2b (Figure 1).
The genetic distances of the DNA sequences of all HPgV-1 positive samples were calculated at 0.0918 ± 0.0110, while it was 0.0980 ± 0.0121 in the patient group and 0.0405 ± 0.0131 in the control group. The patient and the control groups’ genetic distances determined by nucleotide changes were statistically significantly different (p<0.0001).
Discussion
As a result of studies carried out with the changing classification of HPgV since 2015, a better understanding of its biological properties has brought a different perspective, especially with its tendency to lymphocytes. Therefore, in recent years, it has attracted the attention of researchers regarding its effects on HIV infections. A meta-analysis and many studies indicate that people with coinfections have a longer lifespan and progression to AIDS when comparing HIV-infected people without HPgV-1 viremia with HPgV-1/HIV coinfections (18, 25).
The prevalence of HPgV-1 in people with HIV/HPgV-1 coinfection in the world is between 20% and 41% (2, 13). We found the frequency of HPgV viremia in HIV-positive individuals to be 24.78% in our study, and this rate is within the range reported for similar patient groups from various regions of the world. Moreover, in our study, the average HIV viral load samples with HPgV-1 detected in the HIV-positive group was 247,808 ± 784,088 copies/mL, while it was 427,111 ± 1,511,995 copies/mL in the group without HPgV-1. Although the difference between the means of both groups was close to twice, this difference was not statistically significant due to the heterogeneous distribution of viral loads in the group with HPgV-1 (p=0.319).
When it comes to the situation in the world, for instance, in Germany, HPgV RNA was detected in 23.8% of HIV-positive patients. Findings of the genotype analysis made from 5’UTR regions showed that 83.5% of the samples were GT 2, 8.2% were GT 1, and 2.1% were GT 3 (26). A study by Stapleton et al. from the USA found HPgV viremia in 41% of HIV-positive samples. There was no significant difference between patients who received combined ART and those without HPgV viremia (p=0.63). However, it was observed that CD4+ T cell counts were higher in patients receiving combined ART and patients with HPgV viremia (p<0.01) (13). In Brazil, amplification was performed from the E2 region of HPgV in HIV-infected and ART-naive individuals, and 24% of HPgV RNA was detected. A more effective reduction in HIV viral load was observed in HPgV-positive patients receiving ART (p=0.009) (15).
Our country has few studies on HPgV in various patient groups. A study by Hanci et al. on hemodialysis patients in Denizli found HPgV RNA was 14% in patients and 2% in controls (p<0.05), and the presence of HPgV E2 antibodies was 14% in patients and 5% in controls (p<0.05) (27). In İzmir, 12% HPgV RNA was found in hemodialysis patients and 1.2% in controls; GT 2 was detected in five patients in the patient group, and GT 4 was found in one person in the control group (3). In a study conducted with transplant recipients in the kidney transplant unit, the HPgV RNA seropositivity rate was reported as 42%, and the genotype of all isolates was GT 2 (5). According to the study of Akçalı et al. on various risk groups, HPgV RNA was detected in 29% of patients with chronic HBV, 25% of patients on hemodialysis, 7% of patients with chronic HCV, and 4% of healthy individuals (6). Although our study was going to be the first study on HIV-infected patients from Türkiye, a study by Köksal et al. was published during the preparation of our manuscript. Köksal et al. found the prevalence of HPgV RNA in HIV-infected patients to be 27.3% (28).
In our neighbour, Iran, 4.4% HPgV-1 and 0.9% HPgV-2 RNA were found positive in hemophilia patients (29). In Greece, HPgV RNA was detected at 32.1% in acute HBV, 8.6% in chronic HBV, 28% in acute HCV, 26.5% in chronic HCV, 29.1% in patients with non-A-E hepatitis, and 37.6% in healthy volunteers. HPgV-E2 antibody positivity and HPgV RNA positivity were found to be associated with young age (p=0.017), and it was observed that all of the HPgV-positive samples were GT 2a in the study (24). HPgV-1 is transmitted through contact with blood and blood products, sexual contact, and mother-to-child transmission. Therefore, as seen in the results of the aforementioned studies, its co-occurrence rate with other blood-borne viral agents such as HIV, HBV, and HCV is generally high.
In Europe, for instance, HPgV E2 antibodies were found in 13.5% of Swedish blood donors. When looking at age groups, HPgV E2 antibody positivity was primarily observed in donors between the ages of 41-50, and HPgV RNA positivity was common among donors between the ages of 31-40 (11). In a study conducted in Hungary, various subgroups were formed in terms of age, and the highest prevalence of HPgV was seen in the 40-49 age group, while no virus was detected in the subgroup above 50 years of age. In another subgroup consisting of children, the prevalence of HPgV was lower than in other age groups (30). In our study, when the groups were divided as <40 years old and ≥40 years (31), HPgV-1 positivity rates were higher in those aged <40 years (25.80%) than those aged ≥40 years (16.12%) (p=0.00044). Some studies observed that HPgV RNA increases because of more sexual activity in young adults (2), while the risk of infection decreases and HPgV antibody increases in older ages.
HPgV-1 RNA was detected in 24.78% of the patient group and 18% of the control group (p=0.2264). Although 18% HPgV-1 RNA positivity in the control group is a high result compared to studies conducted in healthy control samples in our country, it is compatible with other data reported from our neighbours and the world (10). Similar to our study, a high prevalence of HPgV RNA seropositivity rate (42%) was reported in the study conducted in İzmir, and HPgV RNA was found to be relatively high (12%) in another study conducted in the same region (3, 5).
The fact that all of the genotypes detected in our study were GT 2 also supports the literature and the geographical spread of the virus. The studies by Anastassopoulou et al. from Greece, Vitrenko et al. from Ukraine, and Jõgeda et al. from Eastern Europe showed that the dominant genotype is 2 and the subtype is 2a for our region (24, 32, 33). In our study, 45 (95.56%) of 47 cases with positive HPgV-1 RNA were in GT 2a, while only two samples (4.44%) were in GT 2b (Figure 1). Similarly, Köksal et al. found genotype 2a to be dominant (28).
In our study, when the distances of the DNA sequences of the HPgV-1 positive samples were calculated, the nucleotide distances of all samples were 0.0918 ± 0.0110. It was 0.0980±0.0121 in HIV-infected individuals and 0.0405 ± 0.0131 in the control group. The statistically significant difference between the control group and the patient group regarding nucleotide distances reveals that HPgV-1 shows a more heterogeneous distribution in HIV-infected individuals, while it has a relatively more homogeneous distribution in non-HIV-infected individuals (Table 6). The origins of the control group exhibited an almost monophyletic arrangement topographically in the phylogenetic tree. In addition, two GT 2b strains were identified in HIV patients. HIV-infected individuals, compared to society, have different and various risk factors that may lead to the formation of different clusters among these individuals in HPgV-1, as in HIV. In our study, HPgV-2 RNA was negative in both patient and control groups. Similar results were found in studies investigating HPgV-2 in individuals monoinfected with HIV (14, 34).
Our study has some limitations. Firstly, since our institution is a tertiary university hospital, most of the HIV patients who were sent to be tested for HIV drug resistance were followed up in other centers, and their CD4+ T cell counts could not be reached. Therefore, the relationship between the number of HPgV-CD4+ T cells could not have been evaluated. Second, since the presence of HPgV could not have been studied with quantitative PCR, the relationship between HPgV viral load and HIV could not have been evaluated, either. Additionally, the number of women infected with HIV in the population was lower compared to men, so the number of women in the sample during the study period was also low. Despite the limitations, our study has genuine value in demonstrating HPgV dynamics, especially in HIV-infected individuals and society and revealing phylogenetic relationships between origins.
In conclusion, it was determined that HPgV RNA was detected in approximately one-quarter of HIV-infected individuals and 18% of community-acquired strains. It was observed that the frequency of HPgV-1 in our country was higher in HIV-infected people than in people without HIV. We found that the common genotype was 2a, and it was more heterogeneous in the HIV-infected group. Our findings can shed light on further studies on this subject in order to understand better the effects of the HPgV-1 virus on HIV infection.